Core HR Agent
HR Metrics: 7 Essential KPIs Every HR Manager Must Track
- 05 November, 2026
- 20 Minutes
 Jamie Ho

Table of Content
Corporate boards no longer view workforce changes as an unavoidable cost; unmonitored turnover and hiring delays lose millions in net profits each year. Simple workforce data helps executive teams stop profit loss while aligning team performance directly with business growth.
Executive leaders understand how HR metrics align workforce strategies directly with overall enterprise business goals. Traditional HR departments frequently collect extensive administrative data while failing to utilize HR metrics and analytics to extract actionable strategic insights that influence core business outcomes.
C-suite executives undervalue organizational HR contributions when department leads present vanity metrics instead of decision-driving key performance indicators. Modern executive teams demand precise financial and operational metrics that connect workforce performance directly to profitability and long-term enterprise growth.
In this guide, enterprise leaders will discover the best HR metrics to track for sustainable business outcomes across core strategic pillars. Standardizing these operational indicators provides HR managers with the precise data required to demonstrate clear functional value during board inquiries.
Key takeaways
- HR metrics track general operational performance, whereas HR KPIs monitor specific targets tied directly to corporate revenue goals.
- Workforce analytics helps HR teams turn employee data into actionable insights, supporting more informed decisions about recruitment, retention, workforce development, and productivity.
- The 15 essential HR metrics span recruitment efficiency, retention stability, engagement sentiment, capability building, and workforce expenditure.
- HR managers maximize executive buy-in by tracking three to five core KPIs before expanding into complex predictive models.
- Executive leadership teams review primary HR KPIs quarterly, while department heads evaluate high-velocity indicators monthly.
HR Metrics vs HR KPIs — The Distinction That Matters
HR teams collect data across numerous workforce activities, ranging from recruitment pipelines to employee retention metrics. Understanding what HR metrics are allows enterprise leaders to monitor general department operations and evaluate broad human resource activities across the organization.
HR metrics measure operational outputs across daily business routines, whereas HR KPIs represent specific indicators selected to evaluate progress toward strategic enterprise objectives. Distinguishing administrative measurements from performance indicators enables management teams to focus resources on outcomes that influence core business goals.
Examining practical HR metrics examples clarifies the distinction between basic operational tracking and strategic performance targets:
- HR Metric: Tracking the total number of new hires provides baseline operational data regarding overall recruitment volume.
- HR KPI: Accelerating recruitment speed for critical technical roles sets a targeted performance goal that directly supports company expansion priorities.
The 4 key characteristics define effective key performance indicators across enterprise human capital management:
- Clear and specific: The metric defines precisely what the organization needs to measure without operational ambiguity.
- Business-aligned: The indicator connects departmental performance directly to strategic outcomes that executive leadership prioritizes.
- Actionable insight: Analytical findings enable management teams to make informed decisions and execute timely interventions.
- Accountable ownership: A designated supervisor holds formal responsibility for monitoring progress and driving continuous improvement.
For mid-market enterprises and lean HR departments, learning how to calculate HR metrics selectively prevents operational data fatigue. Rather than tracking every available data point, small human resource teams should focus on 3 to 5 core KPIs aligned with their primary workforce challenges, such as retention stability, hiring velocity, or workforce engagement.
7 Essential HR Metrics: A Framework for Workforce Management
Enterprise leaders require structured data frameworks to evaluate human capital performance across operational departments. Categorizing the best HR metrics to track into 3 core strategic pillars enables HR managers to align workforce analytics directly with corporate financial performance.
Visualizing these operational indicators through an automated HR metrics dashboard accelerates executive decision-making across global site locations. Combining modern HR metrics and analytics equips department leads with precise data to optimize talent management processes in real time.

Category 1: Talent Acquisition & Onboarding Efficiency
Talent acquisition metrics track the speed, financial investment, and overall effectiveness of enterprise hiring operations. Modern recruitment engines process pipeline data continuously to optimize candidate sourcing channels and onboarding workflows.
1. Hiring velocity: measuring time-to-fill
Time-to-hire measures the total calendar days elapsed from initial job requisition approval to final candidate offer acceptance. Operational leads determine how to calculate HR metrics like time-to-hire by subtracting the official position opening date from the offer acceptance date.
Prolonged recruitment timelines signal critical process bottlenecks or insufficient candidate pipeline depth. HR teams must audit interview scheduling protocols and talent pipeline sources when hiring cycles exceed internal operational targets.
- Cost-per-hire: Cost-per-hire evaluates total financial investments required to recruit and onboard a new team member by dividing external sourcing fees and internal recruiter expenses by total new hires. Escalating recruitment costs signal an over-reliance on external staffing agencies or underutilized organic referral programs.
- Candidate sourcing speed: Candidate sourcing speed monitors how rapidly talent acquisition channels generate qualified candidates for open requisitions. Underperforming sourcing channels require immediate recruitment budget reallocations toward higher-converting talent networks.
2. Quality of hire: evaluating new hire performance
Quality of hire assesses the overall long-term value delivered by new staff members across operational roles. Leadership teams evaluate this composite HR metrics example by combining first-year performance ratings, 12 month retention status, and hiring manager satisfaction scores.
Low quality-of-hire metrics reveal severe misalignments between initial candidate screening protocols and actual job role requirements. Talent acquisition teams must refine candidate assessment frameworks and update competency profiles when new hires fail to meet baseline performance expectations.
- 90-day retention rate: Early retention metrics track the percentage of newly hired staff members who remain employed through their initial three months. Elevated early turnover indicates breakdowns in onboarding orientation or mismatched job role expectations created during interviews.
- Time-to-productivity: Time-to-productivity measures how quickly a new employee achieves full working output within their functional team. Lengthening ramp-up periods require department managers to restructure practical training modules and early mentorship support.
Category 2: Retention, Engagement & Workforce Wellbeing
Workforce stability and sentiment metrics convert qualitative employee feelings into actionable operational insights. Advanced continuous monitoring software helps leadership teams identify retention risks and cultural burnout before turnover impacts daily enterprise operations.
1. Workforce stability: measuring retention and turnover
Employee turnover rate tracks total staff departures, while the retention rate measures staff members who remain employed across a designated timeframe. Department managers calculate these paired metrics by dividing total separations or remaining staff by total initial headcount within the evaluation window.
Unscheduled spikes in departmental departures trigger mandatory executive leadership reviews and stay-interview protocols. Unplanned employee turnover imposes severe financial burdens on enterprise resources through lost productivity and repeated onboarding expenses.
- Voluntary vs. Involuntary turnover: Segmenting voluntary resignations from performance-based terminations isolates underlying cultural disengagement from active workforce performance management. High voluntary departure rates signal compensation gaps, toxic management practices, or limited career progression.
- Absenteeism rate: Absenteeism rate measures the percentage of scheduled work hours lost due to unscheduled employee absence. Rising absenteeism serves as an early behavioral indicator of workforce disengagement long before formal resignations occur.
2. Employee advocacy: measuring employee recommendation rates
Employee net promoter score measures overall workforce loyalty and employee willingness to recommend the organization as a desirable place to work. HR teams calculate eNPS by subtracting the percentage of negative detractors from the percentage of enthusiastic promoters.
Negative eNPS results require immediate executive investigation into department management practices and company culture. Leadership teams must establish direct feedback forums to resolve widespread employee dissatisfaction when promotional sentiment drops into negative territory.
- Employee satisfaction score (ESS): Employee satisfaction scores quantify general workforce contentment across daily working conditions and workplace environment parameters. Declining satisfaction scores point to operational friction points across team communication, workload distribution, or supervisory support.
- Survey participation rate: Survey participation rates track employee engagement with corporate feedback tools across operational departments. Dropping response rates signal widespread survey fatigue or workforce skepticism regarding leadership willingness to execute positive change.
3. Burnout risk: monitoring employee burnout indicators
Burnout risk index aggregates behavioral metrics such as declining survey mood indicators, late-night system activity, low peer recognition, and survey fatigue. Enterprise platforms process these continuous data points to calculate automated burnout risk scores across functional teams.
Segmenting burnout risk metrics by department enables leadership teams to identify toxic working environments and unsustainable operational workloads. Supervisors must adjust shift schedules and realign project deliverables when automated risk indices highlight elevated team exhaustion.
- Work-life integration score: Work-life integration scores measure employee perception regarding workload sustainability and personal time boundaries. Deteriorating balance metrics prompt human resource leads to review overtime policies and flexible work arrangements.
- Peer recognition frequency: Peer recognition metrics evaluate the volume of positive feedback exchanged across internal communication channels. Low recognition activity indicates isolated working silos and weakening peer support networks across functional teams.
Category 3: Capability Building & Workforce Productivity
Financial human resource metrics examples evaluate the economic efficiency, staffing ratios, and learning outcomes generated by total human capital investments. Operational analytics platforms connect skill development and labor spend directly to top-line enterprise revenue.
1. Talent mobility: tracking internal promotions and transfers
Internal promotion rate calculates the percentage of open leadership and advanced positions filled by existing company employees. HR teams evaluate this mobility metric by dividing total internal promotions by total open position fulfillments over a specific operational period.
Low internal promotion rates indicate stagnant career progression pathways that push high-performing talent toward external opportunities. Enterprise leaders must strengthen internal mentorship initiatives and clear succession planning frameworks when leadership roles remain filled primarily through external hiring.
- Training completion rate: Training completion rate monitors the percentage of assigned workforce learning modules completed within designated operational timeframes. Low completion rates signal unengaging instructional content, poor accessibility, or inadequate dedicated learning time during regular work hours.
- Training return on investment (ROI): Training ROI evaluates net financial and operational performance improvements generated relative to total learning program expenditures. Negative training ROI values require department heads to update course curriculums and instructional delivery methods.
- Skill gap closure rate: Skill gap closure rate measures workforce mastery across targeted technical and managerial competencies over specific evaluation cycles. Stagnant closure rates reveal ineffective practical application opportunities within daily operational workflows.
2. Revenue per employee: assessing revenue generated per employee
Revenue per employee measures total average top-line revenue generated by each active workforce member. Financial leads calculate this fundamental productivity ratio by dividing total annual enterprise revenue by total average headcount.
Declining revenue per employee ratios signal emerging productivity gaps, overstaffing issues, or inefficient operational workflows. Executive management must review talent allocation and operational processes when revenue output fails to match total workforce growth.
- HR-to-employee ratio: HR-to-employee ratio tracks dedicated human resource professionals relative to overall enterprise headcount. Ratios exceeding industry benchmarks highlight immediate opportunities for administrative HR process automation and digital self-service workflow integration.
- Overtime hours: Overtime hours track cumulative hours worked beyond standard contractual working schedules. Sustained overtime spikes occurring without corresponding increases in production volume signal severe operational disengagement or improper resource allocation.
Explore Blazeup to learn how automated workforce applications simplify data collection and surface real-time HR metrics for executive decision-making.
A Strategic Approach to HR Reporting
Establishing a structured reporting framework enables HR leaders to transform raw data into decision-ready strategic insights for enterprise executives. Executive teams rely on a clear four-step implementation methodology to align departmental analytics directly with corporate governance standards.
Enterprise leaders can review the diagram below to visualize how raw workforce data transforms into strategic executive reporting layers.
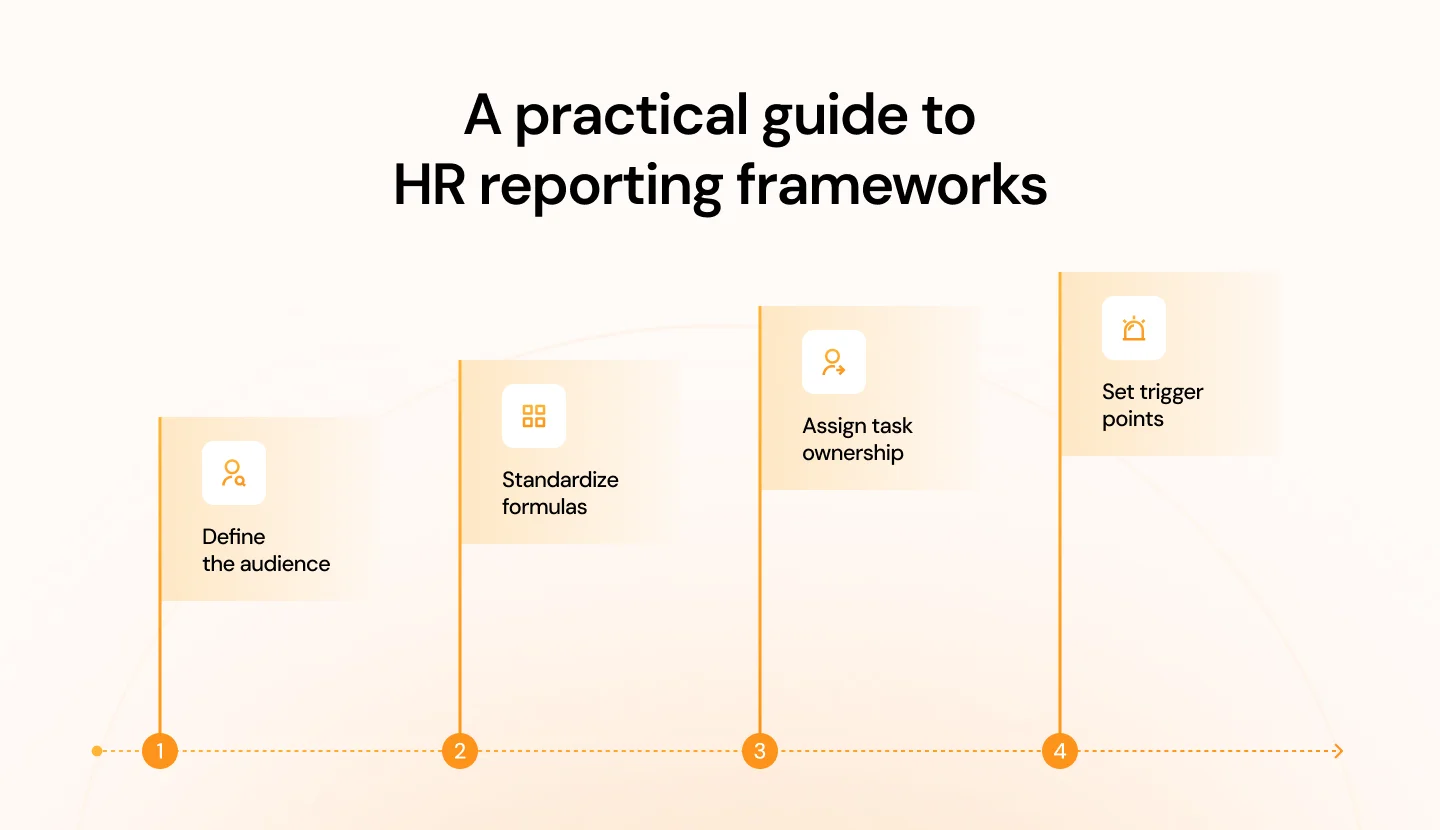
1. Define the audience
Distinct management tiers require tailored operational perspectives across executive reporting levels. Chief executive officers prioritize revenue per employee alongside total retention costs, whereas department heads monitor localized turnover dynamics and employee engagement metrics.
Corporate boards demand high-level diversity, equity, inclusion (DEI), and compliance indicators. These requirements demand customized HR metrics dashboard views designed for each specific leadership segment.
HR teams create customized report templates for each management tier, mapping specific operational KPIs to executive decision-making schedules. Department managers review granular team metrics weekly, while corporate boards evaluate consolidated enterprise analytics during quarterly governance reviews.
For example: An enterprise human resource team configures an automated dashboard that sends weekly turnover alerts to department managers. The same system delivers quarterly financial labor cost summaries directly to the chief executive officer.
2. Standardize formulas
Data consistency depends on clear enterprise-wide documentation regarding how to calculate HR metrics across operational units. Leadership teams must define exact calculation methodologies, including variables, excluded data points, and specific evaluation periods for every metric.
Sharing this standardized calculation guide with all department managers maintains operational reporting integrity across enterprise teams. Clear guidelines eliminate discrepancies in multi-regional performance evaluations.
Operations teams document every HR metric formula in a central knowledge repository accessible to all data contributors. Analytics managers audit incoming data inputs monthly to verify that regional sites follow identical reporting standards.
For example: HR leaders establish an enterprise data dictionary specifying standardized metric definitions. This documentation dictates that voluntary employee turnover calculations must exclude temporary seasonal workers and internal departmental transfers.
3. Assign task ownership
Accountability drives continuous performance improvement across human resource operations. Functional leaders must assign one specific team member responsibility for data collection, analytical review, and performance intervention for each metric. Establishing clear operational ownership prevents data gaps across reporting lines. Dedicated leads maintain consistent progress toward departmental performance targets.
Department heads map each metric in the enterprise framework to a designated data owner, embedding metric tracking tasks into regular job responsibilities. Data owners review performance trends weekly and submit intervention proposals whenever metrics drift from targets.
For example: A talent acquisition director takes formal ownership of the candidate sourcing speed metric. This manager conducts monthly reviews to resolve hiring bottlenecks alongside departmental leads.
4. Set trigger points
Analytical measurements generate strategic value only when performance data prompts timely management action. Operations leads must define clear intervention thresholds that trigger leadership reviews before publishing initial executive reports.
Pre-determined trigger points ensure that continuous HR metrics and analytics drive immediate operational adjustments. Executive teams receive clear operational signals to execute timely interventions across departments.
Operations teams program automated system notifications that alert department supervisors whenever a metric crosses a pre-set performance threshold. Management teams meet immediately upon receiving threshold alerts to execute pre-approved corrective action plans.
For example: HR platforms send an automated alert to senior leadership when quarterly voluntary turnover within a critical department exceeds five percent. This automated notification prompts an immediate stay-interview audit.
How to Present HR Metrics to Leadership
Enterprise HR leaders secure strategic board alignment by translating workforce analytics into executive-ready presentation frameworks. Enterprise executives require concise performance storytelling to evaluate how human capital operations directly impact organization-wide financial performance.
The section below details 4 essential communication principles for presenting core workforce analytics to executive stakeholders:

1. Connect every metric to a revenue story
Executive boards evaluate departmental performance primarily through corporate revenue and financial loss lenses. HR teams must convert operational figures like absenteeism and open positions directly into baseline revenue implications.
Financial analysts collaborate with human resource managers to map operational metrics directly to quarterly corporate P&L statements. Management teams present total turnover costs by multiplying cost-per-hire averages against total open roles and average replacement timelines.
For example: Employee turnover can create significant financial costs for businesses. According to Gallup, replacing an employee can cost between 1.5 and 2 times their annual salary, depending on the role and circumstances.
2. Use industry benchmarks
Raw operational numbers lack clear strategic value without external market context. Enterprise leaders require standardized industry metrics to determine whether internal performance metrics represent competitive operational advantages.
Analytics teams integrate third-party market data into internal reporting tools before publishing executive performance summaries. Data leads compare internal operational metrics against regional industry standards inside every HR metrics dashboard view.
For example: HR leaders can compare their internal hiring timelines with SHRM’s 2025 Recruiting Benchmarking data, which reports a median time-to-fill of approximately 45 days for both executive and nonexecutive positions.
3. Lead with exceptions
Executive stakeholders possess limited time to review extensive multi-page performance reports during board meetings. Management teams must highlight data points that drift outside pre-determined operational thresholds rather than summarizing baseline performance metrics.
Operations teams compile a concise one-page exception document that replaces traditional 40-slide presentation decks. Department supervisors flag critical performance variances automatically using standardized metric triggers.
For example: HR leaders highlight a measurement gap in recruitment, as Gartner research found that only 28% of recruiting leaders measure quality of hire. This signals an opportunity for organizations to establish clearer evaluation criteria and track the long-term outcomes of hiring decisions.
4. Show trends over snapshots
Isolated single-period measurements represent statistical noise rather than meaningful operational guidance. Strategic insights emerge only when enterprise leaders analyze continuous historical performance data across multiple evaluation periods.
Data engineers design executive dashboards to display performance metrics across a minimum of three consecutive measurement periods. Department heads evaluate historical trajectory lines to confirm whether past corrective actions generated sustainable operational improvements.
For example: Analytics teams use SHRM’s 2025 recruiting benchmarks to compare hiring costs across different roles. The report shows that median cost-per-hire reached $10,625 for executive positions and $1,200 for nonexecutive positions.
Conclusion
Enterprise leaders convert human capital management into a proactive growth driver by deploying a structured 15-metric framework across enterprise operations. Standardized data pipelines, automated dashboards, and exception-based reporting allow executive teams to align workforce analytics directly with corporate financial performance.
HR managers achieve immediate analytical ROI by prioritizing three foundational indicators: voluntary turnover rate, time-to-fill, and Employee Net Promoter Score. High-performing organizations connect every workforce measurement to baseline revenue outcomes, presenting core HR metrics and analytics in the exact quantitative language that corporate boards demand.
HR directors replacing static spreadsheets find clear strategic direction by embedding these foundational workforce indicators into weekly management reviews. Incremental software deployment allows mid-market HR teams to demonstrate immediate analytical value while building long-term organizational capability.
Looking to automate complex HR data into actionable executive insights?
Enterprise operations can try Blazeup to consolidate recruitment metrics, employee engagement indicators, and labor costs into a single unified workspace.
Frequently Asked Questions (FAQs)
1. What are HR metrics?
HR metrics represent quantifiable operational measurements that track the cost, efficiency, and overall impact of enterprise workforce activities. Modern HR platforms aggregate these data points automatically across payroll systems and applicant tracking tools to provide continuous executive visibility.
2. What is the difference between HR metrics and HR KPIs?
HR metrics monitor broad daily operational performance across departmental activities, whereas HR KPIs track specific strategic targets aligned directly with corporate revenue goals. Operational leads evaluate dozens of baseline metrics continuously, while executive boards select three to five core KPIs to measure quarterly executive performance.
3. Which HR metrics should a small business track first?
Growing enterprises achieve immediate analytical ROI by prioritizing three core metrics: voluntary turnover rate, candidate time-to-fill, and Employee Net Promoter Score (eNPS). Establishing clear operational baselines across these primary indicators resolves hiring bottlenecks and early retention risks before expanding into complex predictive analytics tools.
4. How often should HR KPIs be reviewed?
Review cadences depend directly on executive management tiers and the operational pace of specific workforce indicators. Department supervisors evaluate weekly sourcing speed and monthly absenteeism during operational stand-ups, while executive leaders analyze quarterly talent acquisition costs and annual succession planning frameworks during formal board meetings.